Knowledge Graphs: The Future of Talent Management
At Beamery, we use semantic web technology to build knowledge graphs representing organizations and their people. This means capturing data on everything from the candidate experience, through to off-boarding.
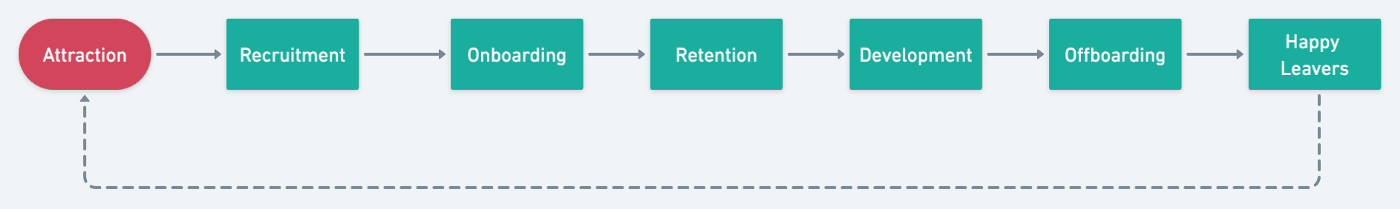
The Academy to Innovate HR (AIHR) has condensed this process into seven distinct steps:
With a little more detail and context on the underlying enabling technology:
- Attraction — marketing and advertising your employer brand as a desirable place to work. Communicating what it is like on the ground.
- Recruitment — sourcing, assessing and vetting candidates to join an organization. (Software Stack — Applicant Tracking System (ATS), Candidate Relationship Management (CRM) system, referral platform, video interview software, identification verification software.)
- Onboarding — equipping a new employee to succeed at their role. (Software Stack: Learning Management System (LMS), Human Capital Management (HCM) system.)
- Retention — ensuring employees are effective and enjoying a role, and therefore likely to stay at an organization. (Software Stack: HCM.)
- Development — growing and progressing staff is a key part of retention. (Software Stack: LMS, internal mobility system, HCM.)
- Off-boarding — managing the process of an employee leaving in a professional and compliant manner. (Software Stack: HCM, alumni management system.)
- Happy Leavers — engaging previous employees. This can also involve re-targeting them as potential recruits. (Software Stack: marketing automation system, content management system (CMS), alumni management system.)
Now, that’s a really large amount of software sprawl required to power such a complex operation. Imagine you have four different legal entities from various mergers and acquisitions — you might now have four different software products for each system listed above. A lot of siloed data and complexity.
Software sprawl is the enemy of efficiency and productivity. Invariably many of the tools listed above will be underutilized as they overlap with one another, or don’t quite fit the needs of users. What’s more, sprawling systems can make compliance more complicated, bewilder users, and are very often more expensive than a 360 solution.
Imagine a world where your HR software stack ended up looking like this:

Everything tackles a bit of the talent lifecycle, but never all of it.
How have we ended up here?
For a long time, this status quo of various disparate HR systems has remained. This is largely because:
- Humans are difficult to model at a point in time. We aren’t like machines — we don’t fit into clearly defined categories, have clear identifying numbers, nor do we have timestamps reported in a specific standard. It’s difficult to unify data with differing taxonomies and standards of reporting.
- Humans are difficult to model over time. There hasn’t ever been a single data source to track a person’s career over time. It just doesn’t exist. Instead, we are piecing together snippets.
There are various reasons that staying with this status quo is no longer acceptable. Consider the following reasons for disruption in software servicing the talent lifecycle:
- The COVID-19 pandemic driving talent to often migrate, and/or reevaluate occupations.
- The labour market has tightened.
- Technology advances are making skills more niche and harder to source.
- Record levels of employment driven by a long period of low interest rates, increasing labor market flexibility.
- Increasing numbers of highly technical roles have little or no formal vocational training pathways. For instance, software engineers lack a prescribed pathway via formal university education.
- Acceptance that diversity and inclusion is both a moral requirement, but also a business need.
Enter the knowledge graph
The Venn diagram above is a nightmare for data management. Here at Beamery we are working to solve exactly that problem.
If you don’t yet know the basic principles behind knowledge graphs, the following definition may be helpful:
“A highly flexible no-sql database which represents data as “knowledge” through a graph-like structure of nodes and edges. Information is represented much like someone might draw a mindmap, or creatively related ideas together on a piece of paper. The nodes that refer to the knowledge are often defined in an ontology — the concepts that describe the domain. They can be traversed semantically using domain knowledge.”
It’s because of this flexibility, and strong reliance on a strongly typed ontology, that we are able to easily aggregate different data sources. We can represent data from multiple sources as closely related knowledge. Think of it a bit like this:

What we get in the knowledge graph is a unified view of all the original data sources. They are interlinked, normalized, and up to date. This gives us the ultimate data source for talent intelligence, strategy and management.
For more information on the technical implementation of this, check out this article on Medium. It’s a complex field, and not a trivial process. But we are working hard to make Talent Lifecycle Management more efficient and productive, by making skills data easier to understand and work with, across every HR system.